XAU/USD Weekly Elliott Wave Forecast Overview
Gold (XAU/USD) continues to dominate trader attention as a safe-haven asset amid global economic uncertainty, inflation expectations, and changing central bank policies. With volatility increasing, professional traders rely heavily on structured technical analysis to identify high-probability setups.

This XAU/USD Elliott Wave Analysis and Forecast for 16 January to 23 January 2026 is presented from the Real World Trading Community perspective. The focus is on real market structure, clear invalidation levels, and practical trade planning rather than prediction-based trading. The analysis is built using multi-timeframe Elliott Wave Theory to align traders with the dominant trend while managing downside risk.
Major Takeaways
Main Scenario (Bullish Bias)
- Trading Direction: Buy on corrections
- Key Support Level: 4,403.95
- Entry Zone: Corrections above 4,403.95
- Target Zone: 4,850.00 – 5,050.00
- Buy Signal: Price holds above 4,403.95
- Stop Loss: Below 4,403.95
- Take Profit: 4,850.00 – 5,050.00
The primary outlook remains bullish as long as the market respects the key structural support level.

Alternative Scenario (Bearish Risk)
- Trading Direction: Sell on breakdown
- Sell Signal: Breakout and consolidation below 4,403.95
- Downside Targets: 3,984.50 – 3,742.00
- Stop Loss: Above 4,403.95
- Take Profit: 3,984.50 – 3,742.00
A confirmed breakdown below support would invalidate the bullish wave structure and shift momentum toward sellers.

Main Scenario Explained – Bullish Outlook
From the Real World Trading Community viewpoint, the current price action favors trend continuation rather than reversal. Gold is still trading within a broader impulsive structure, indicating that buyers remain in control.
Instead of chasing price at higher levels, traders are advised to wait for corrective pullbacks above the 4,403.95 zone. This level acts as a decision point where bullish momentum either holds or fails. As long as price remains above it, long positions are technically justified.

The upside projection toward 4,850.00 – 5,050.00 aligns with common Elliott Wave extension targets typically seen during the final stages of impulsive moves in commodities like gold.
Alternative Scenario – Breakdown and Bearish Continuation
Professional trading always involves preparing for invalidation. No technical structure is guaranteed, and markets often react sharply to unexpected fundamental developments.
If XAU/USD breaks below 4,403.95 and starts consolidating underneath this level, it would signal that bullish momentum has weakened. In such a case, sellers may take control, pushing price toward lower demand zones.
Under this bearish scenario, gold could decline toward 3,984.50 initially, with a deeper corrective move potentially extending to 3,742.00. This move would represent a larger correction within the broader market cycle.
Elliott Wave Analysis Across Multiple Timeframes
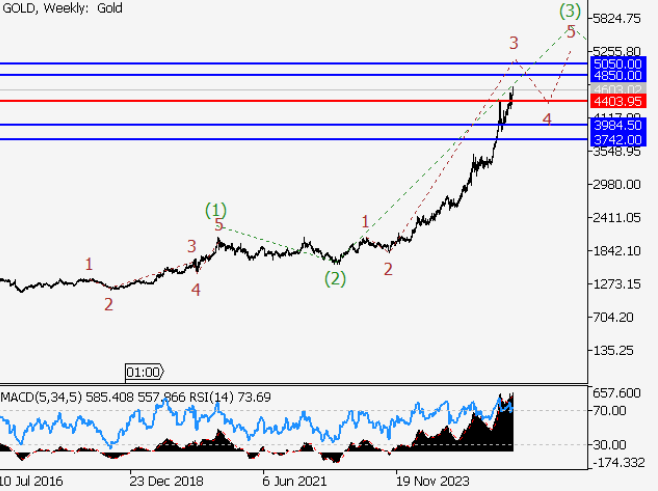
Weekly Chart Perspective
On the weekly chart, XAU/USD appears to be developing an ascending fifth wave of a larger-degree Wave 5. This phase often represents the final impulsive leg of a long-term bullish trend.
From a Real World Trading Community perspective, fifth waves in gold can extend significantly, especially during periods of heightened macroeconomic uncertainty and strong safe-haven demand.
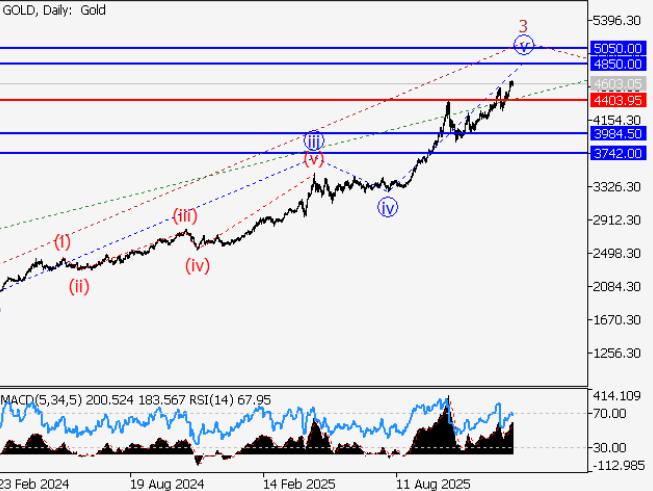
Daily Chart Structure
The daily timeframe shows Wave (3) of 5 continuing to develop. According to Elliott Wave Theory, third waves are usually the strongest and most dynamic phases of a trend.
Strong momentum, shallow pullbacks, and sustained buying pressure support the expectation of further upside as long as key support remains intact.
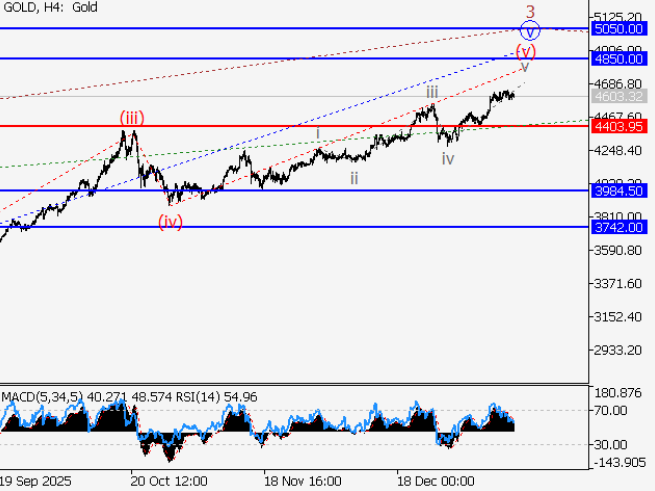
H4 Chart Development
On the H4 chart, Wave v of 3 is unfolding, with Wave (v) of v currently forming. This lower-timeframe structure confirms that bullish momentum is still active in the short term.
As long as price action holds above 4,403.95, the current wave count remains valid and supports higher price projections.
Why the 4,403.95 Level Is Critical
The 4,403.95 level is the most important technical reference point in this forecast. From a Real World Trading Community standpoint, it acts as:
- Structural support
- Elliott Wave invalidation level
- Bullish versus bearish decision zone
Holding above this level keeps buyers in control, while a sustained break below it shifts market bias toward sellers.
Risk Management and Trading Discipline
While Elliott Wave Theory provides a powerful framework, no strategy works without proper risk management. Traders should always define risk before entering a trade, use stop losses consistently, and avoid emotional decision-making.
Fundamental factors such as interest rate decisions, inflation data, and geopolitical developments can quickly impact gold prices, so flexibility remains essential.
Final Thoughts from the Real World Trading Community
Based on the current Elliott Wave structure, XAU/USD is expected to continue its bullish movement toward 4,850.00 – 5,050.00 during the period of 16–23 January 2026, provided price remains above 4,403.95.
However, traders must respect invalidation levels. A confirmed breakdown below key support would shift the outlook toward the bearish scenario, targeting lower price zones.
This forecast is based on Elliott Wave Theory and Real World Trading Community principles, focusing on structure, confirmation, and disciplined execution. Market conditions can change at any time, and traders should always trade responsibly.\
Tags: XAU/USD forecast, Gold Elliott Wave analysis, XAU/USD price prediction, Gold weekly forecast, Elliott Wave gold forecast, XAU/USD technical analysis, Gold trading analysis, XAU/USD support resistance